I run DrawingBots.net, PlotterFiles.com and have been very active in the plotter community in the recent years. Time to time, I get to try another plotter and evaluate it. In this blog post, I will review Sovol SO2 Plotter provided to me by the manufacturer. I will focus on the plotting function in this blog post and will review the laser function in the next post.
Sovol SO2 is a multi-functional plotter/laser engraver with bed size of 280x210mm. The plotter uses GCode to operate, and uses a small stepper motor to lift the pen carriage / laser carriage up and down.
Unboxing
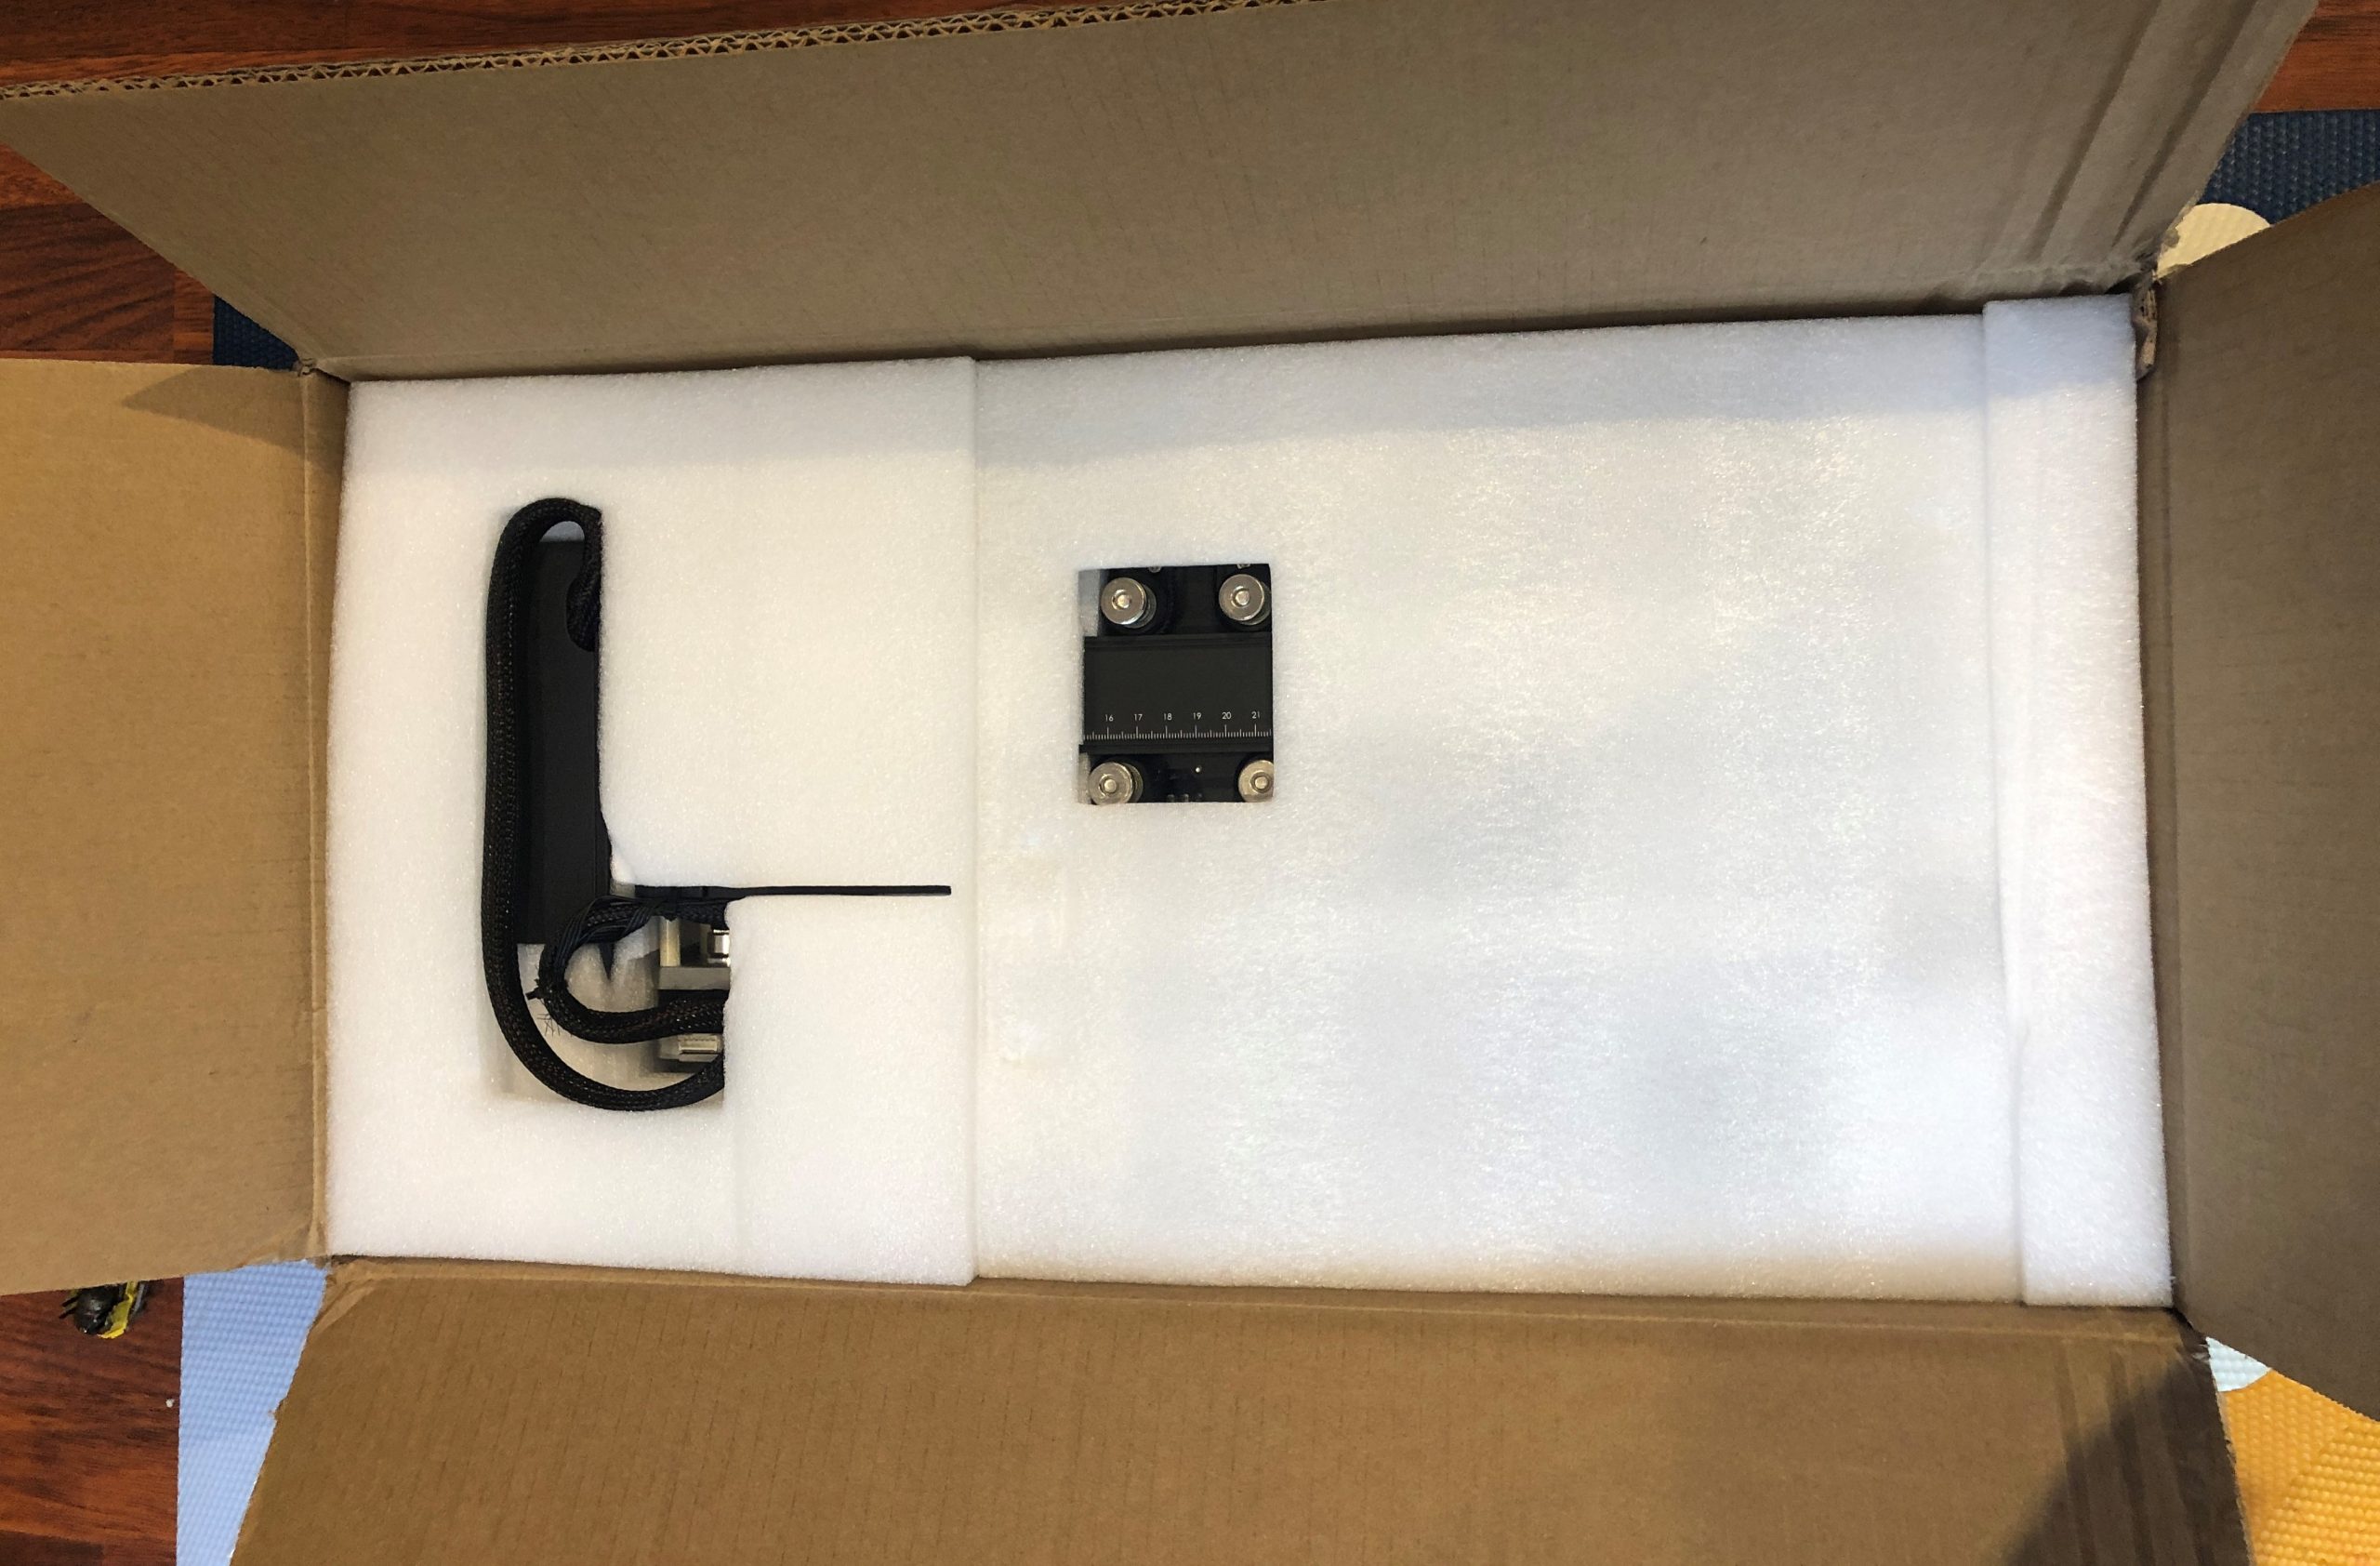
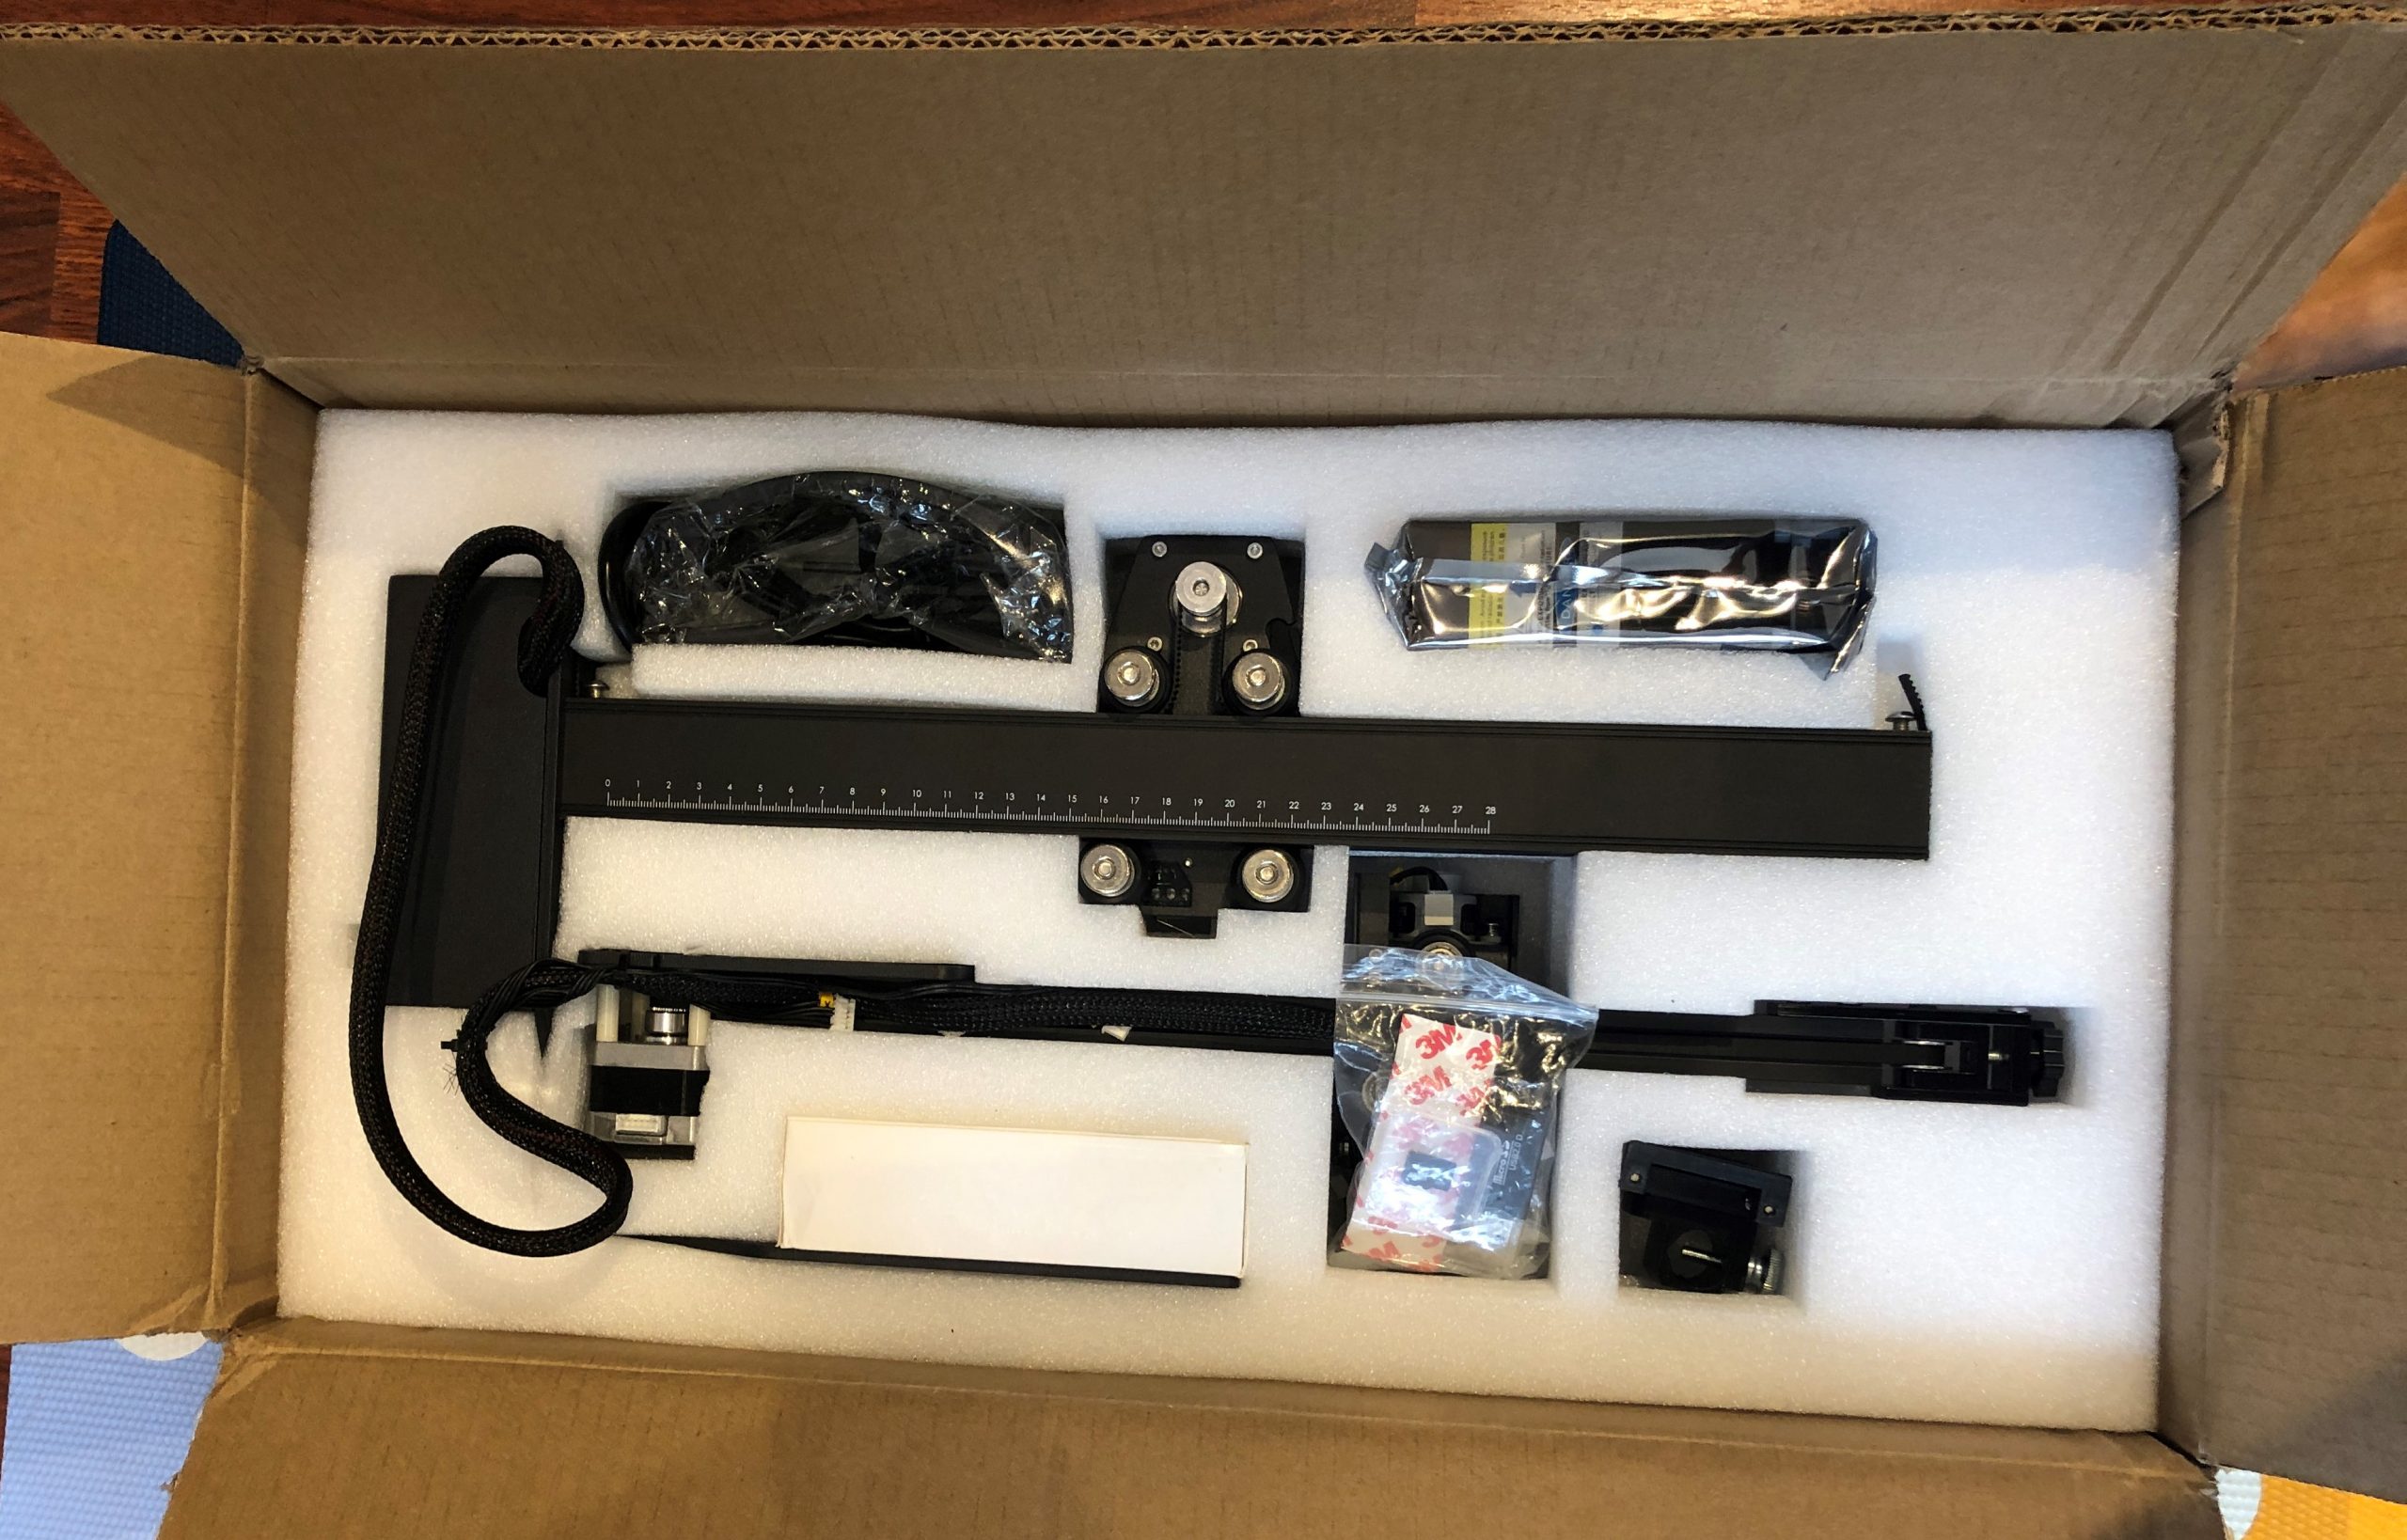
The plotter comes neatly packaged and well-protected. Inside the box, you will find the following:
- Disassembled plotter that consists of 2 parts
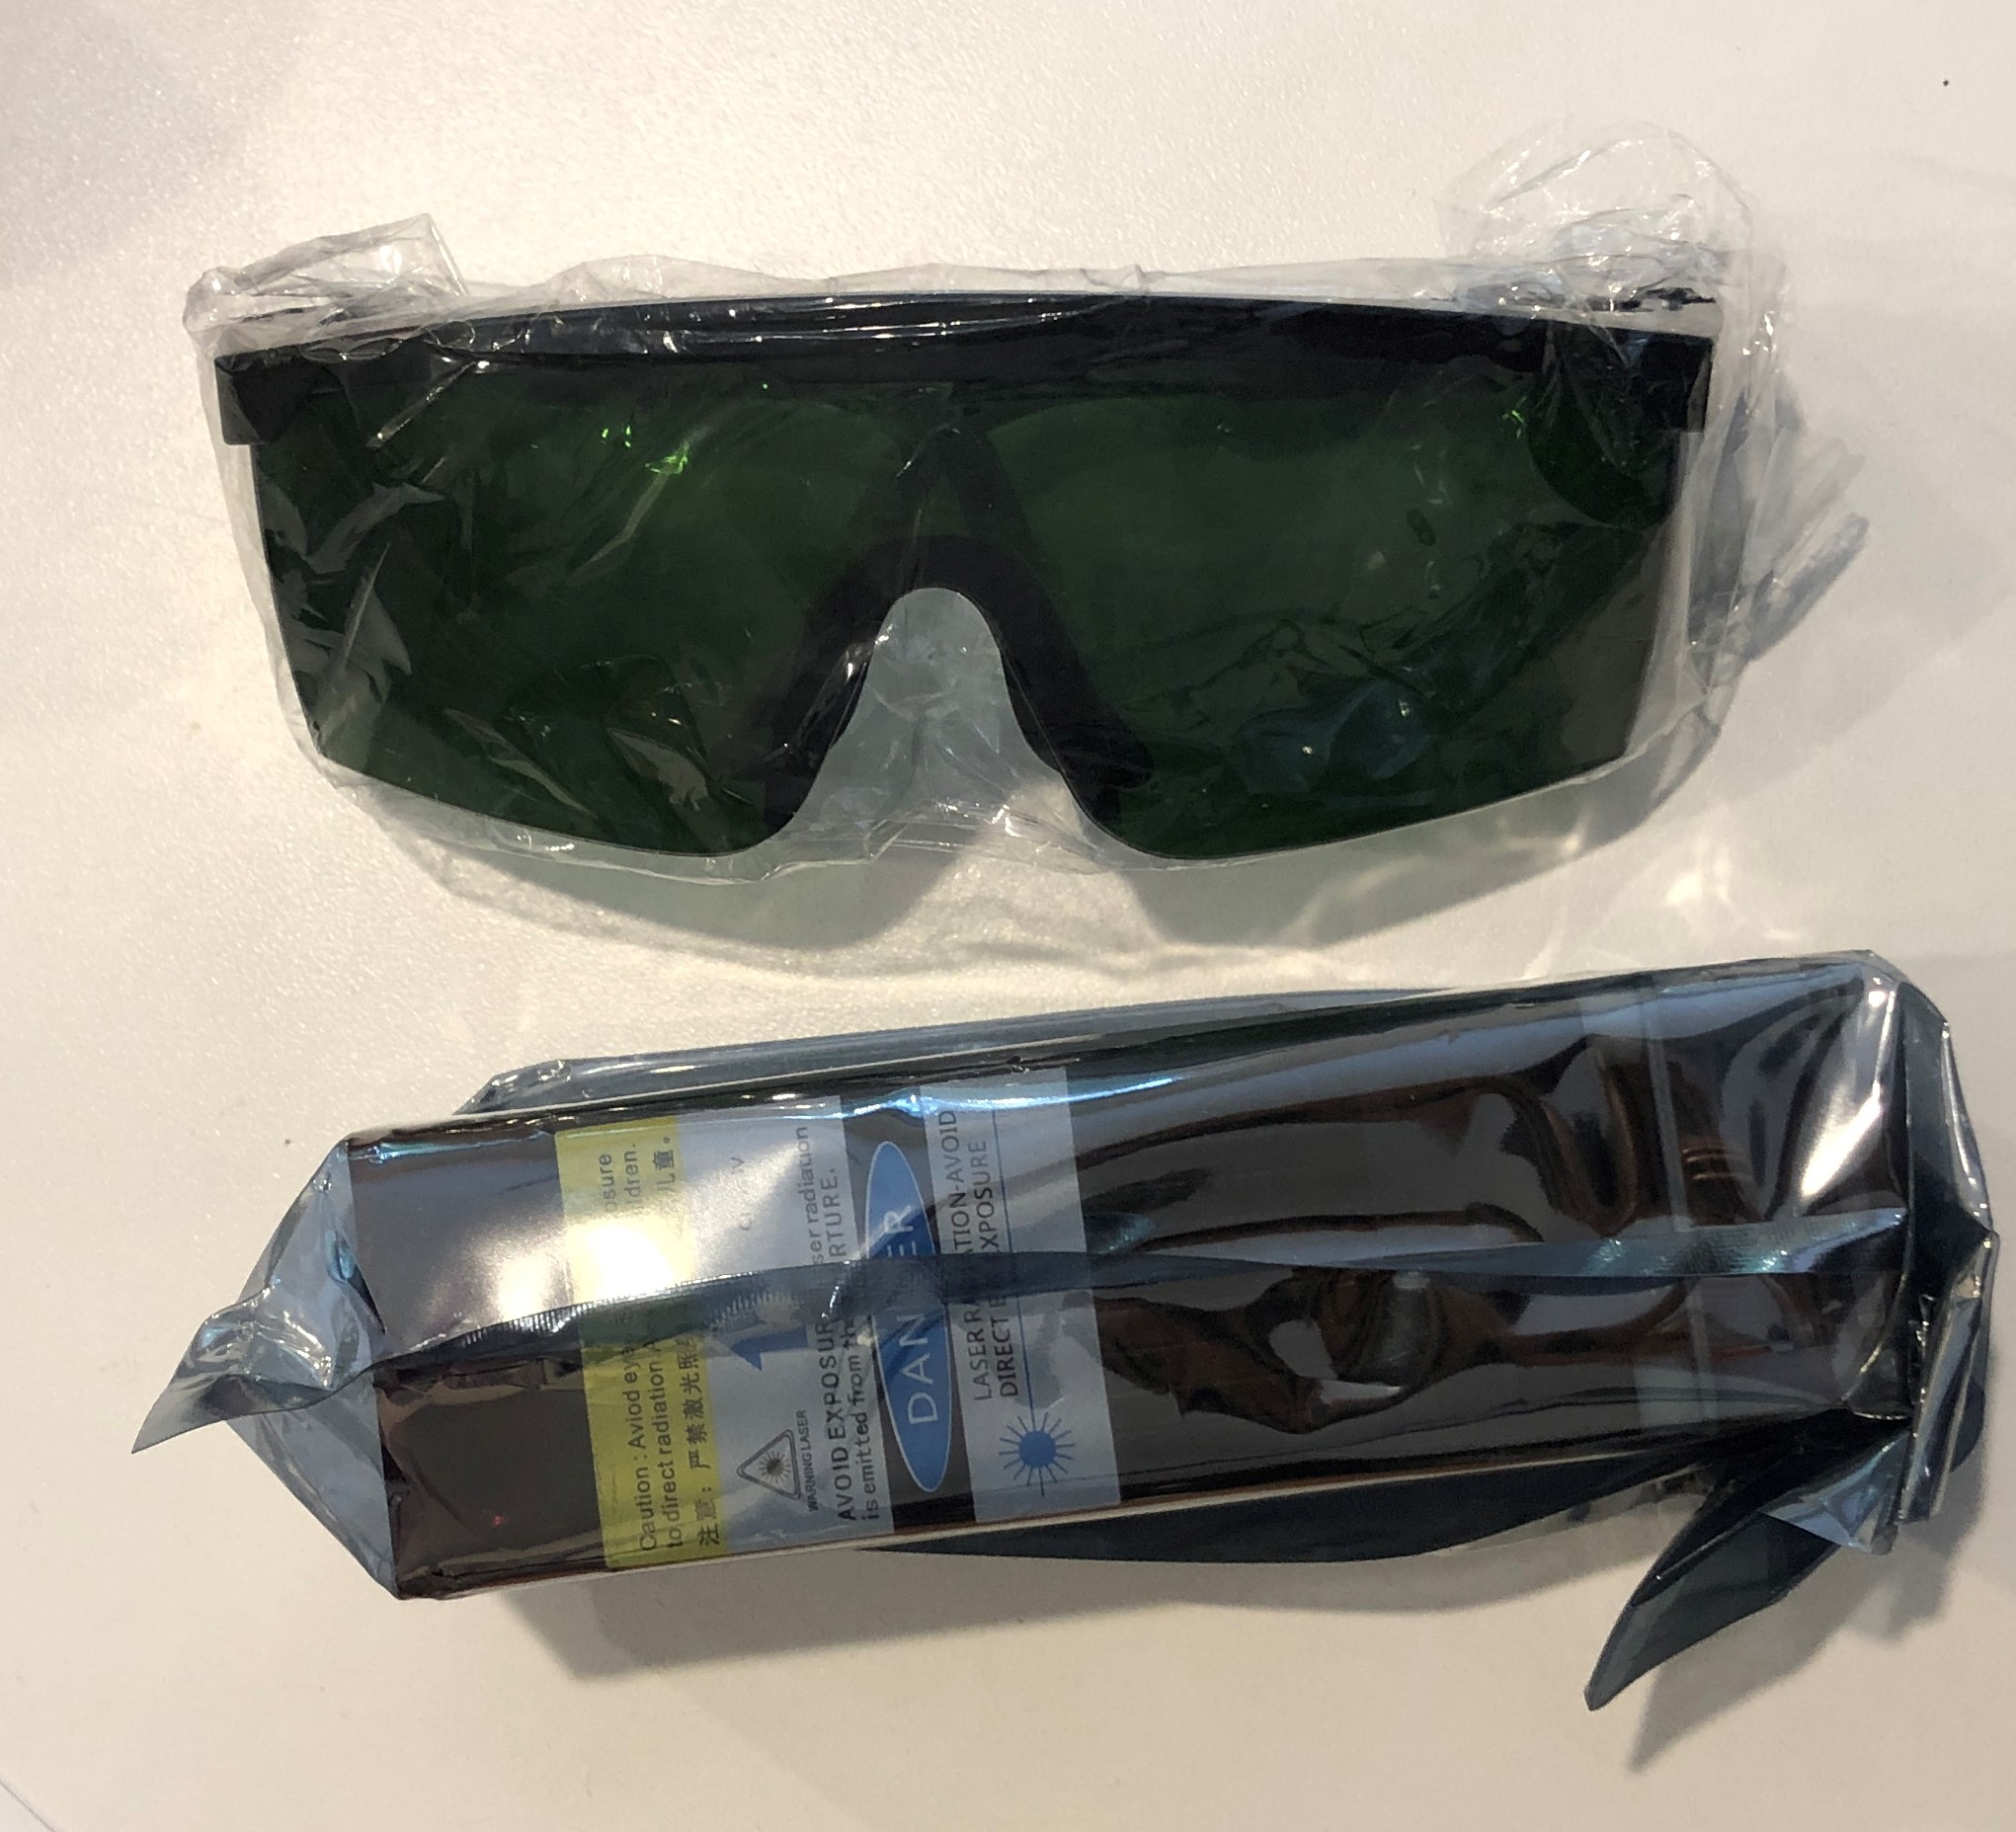
- Laser head and protective glasses
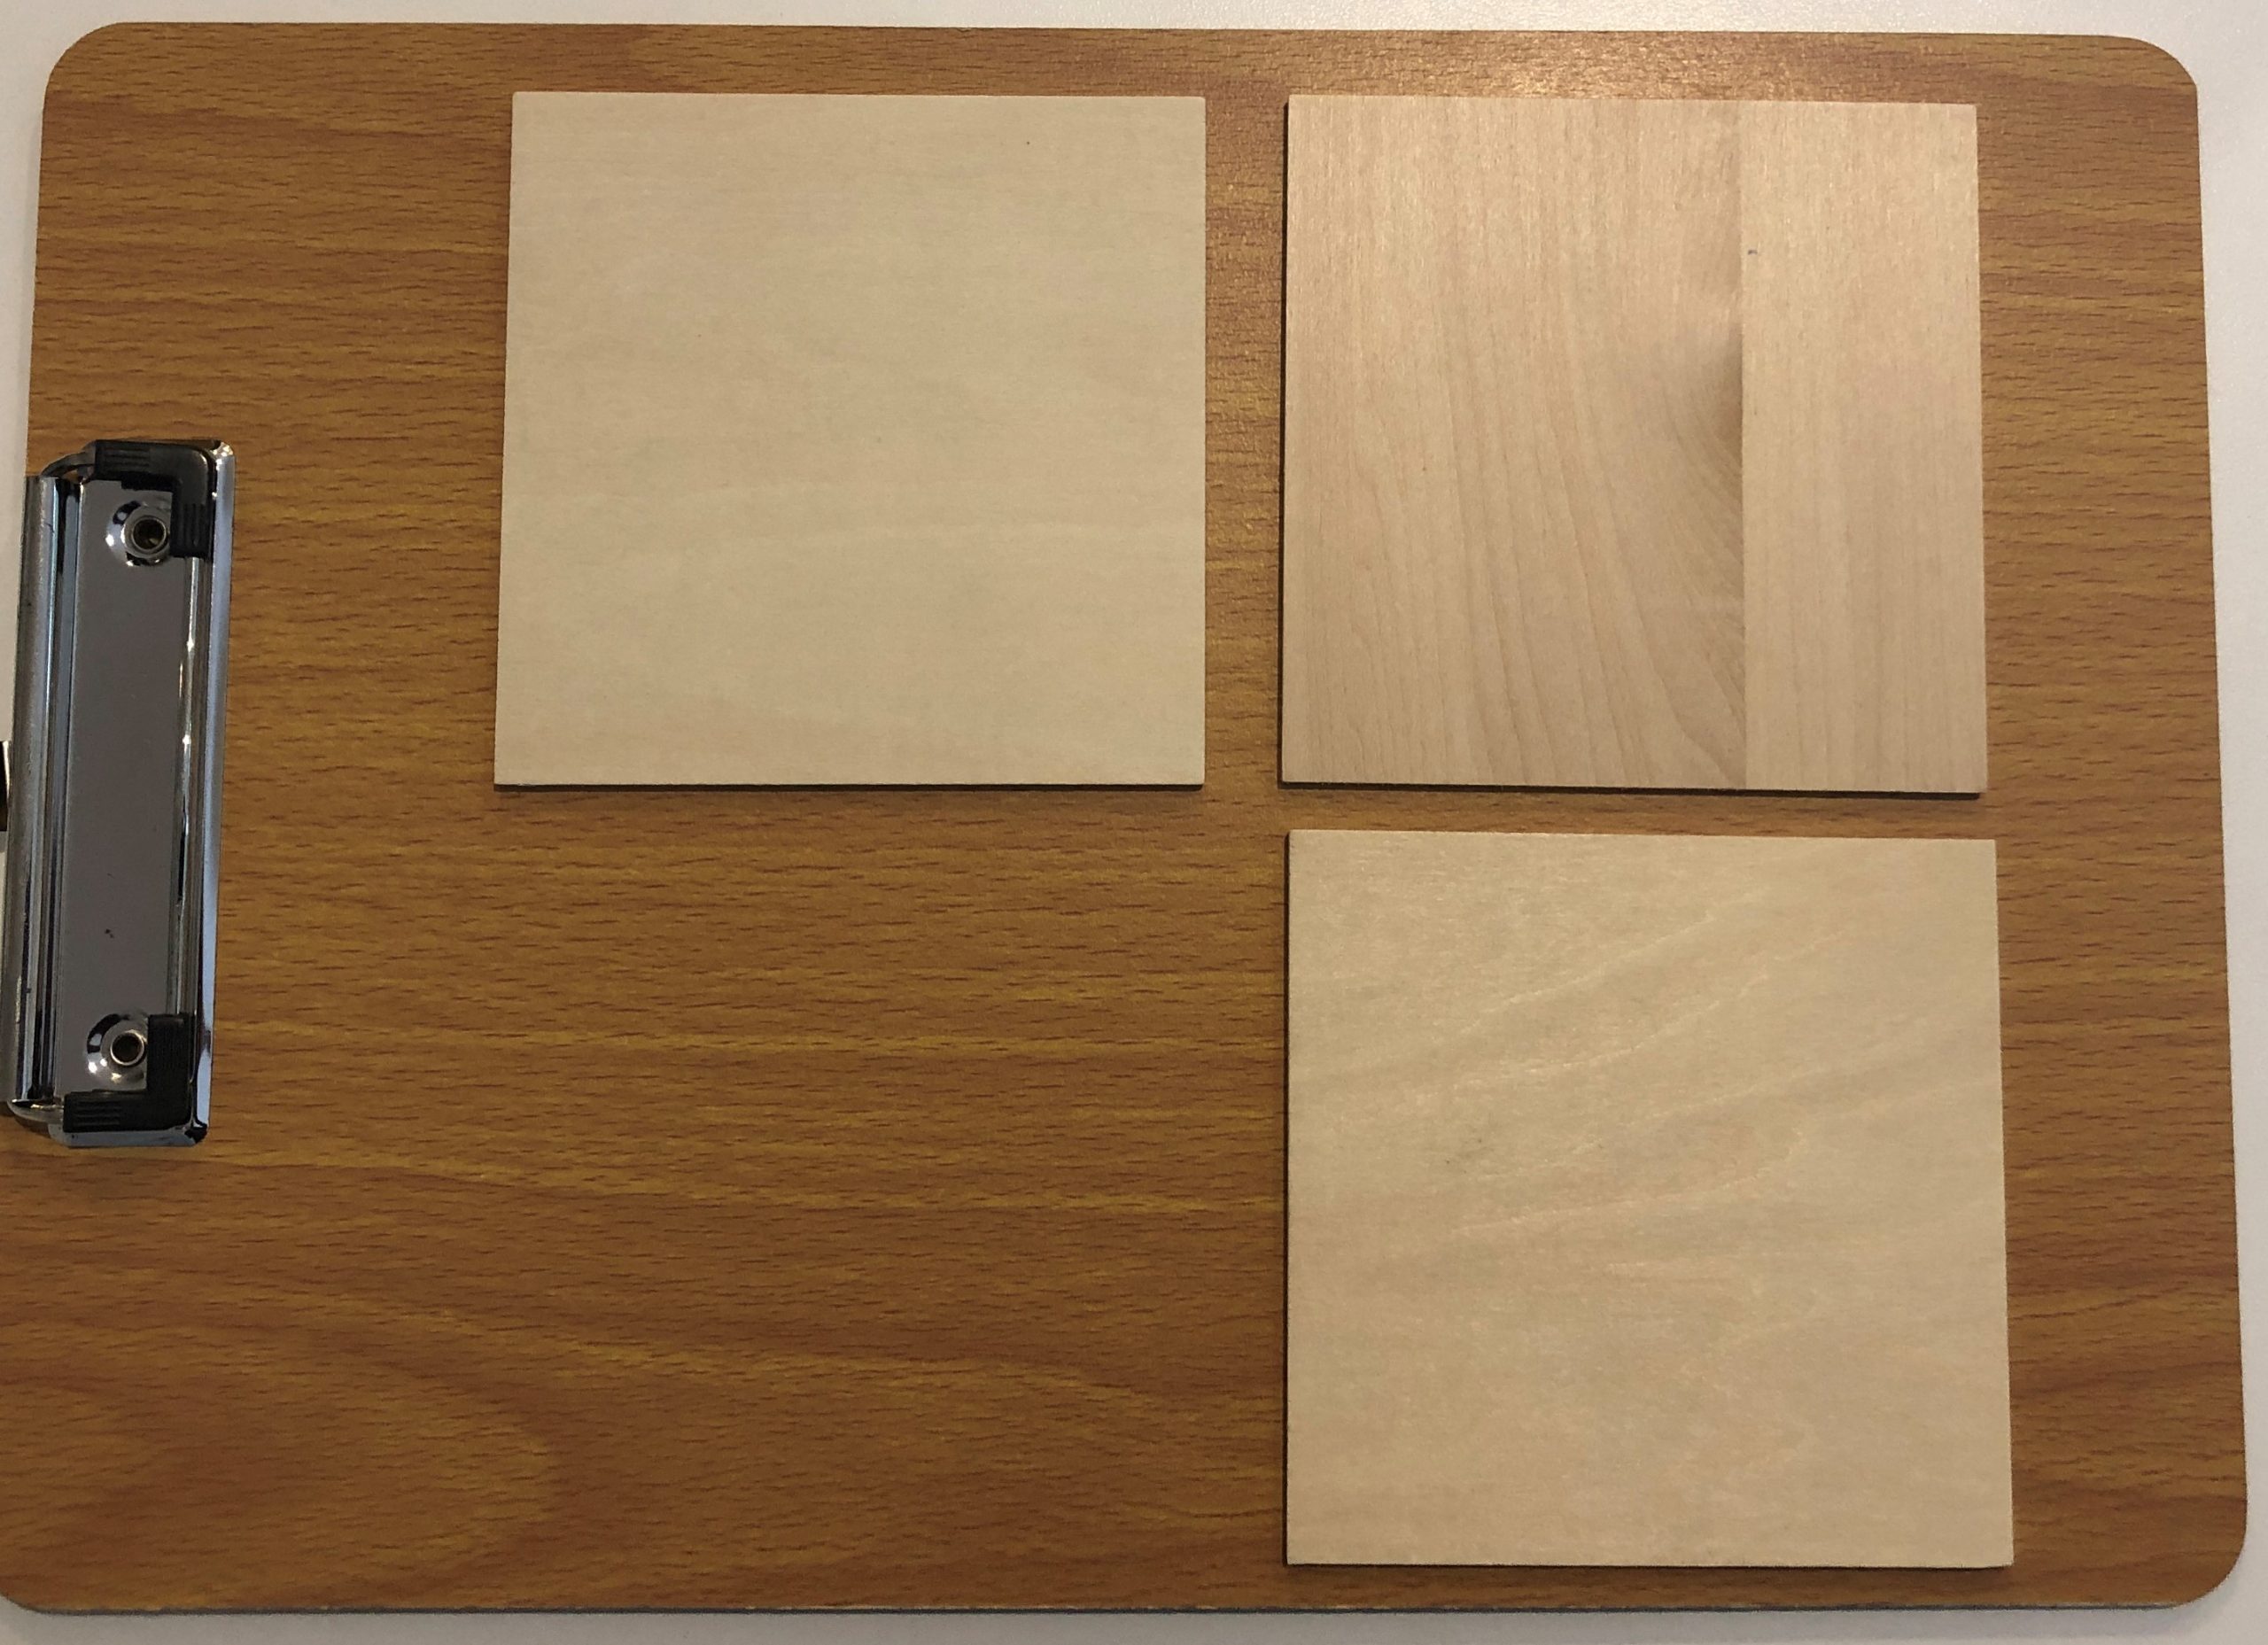
- Sample wood tiles for engraving
- Clipboard for paper
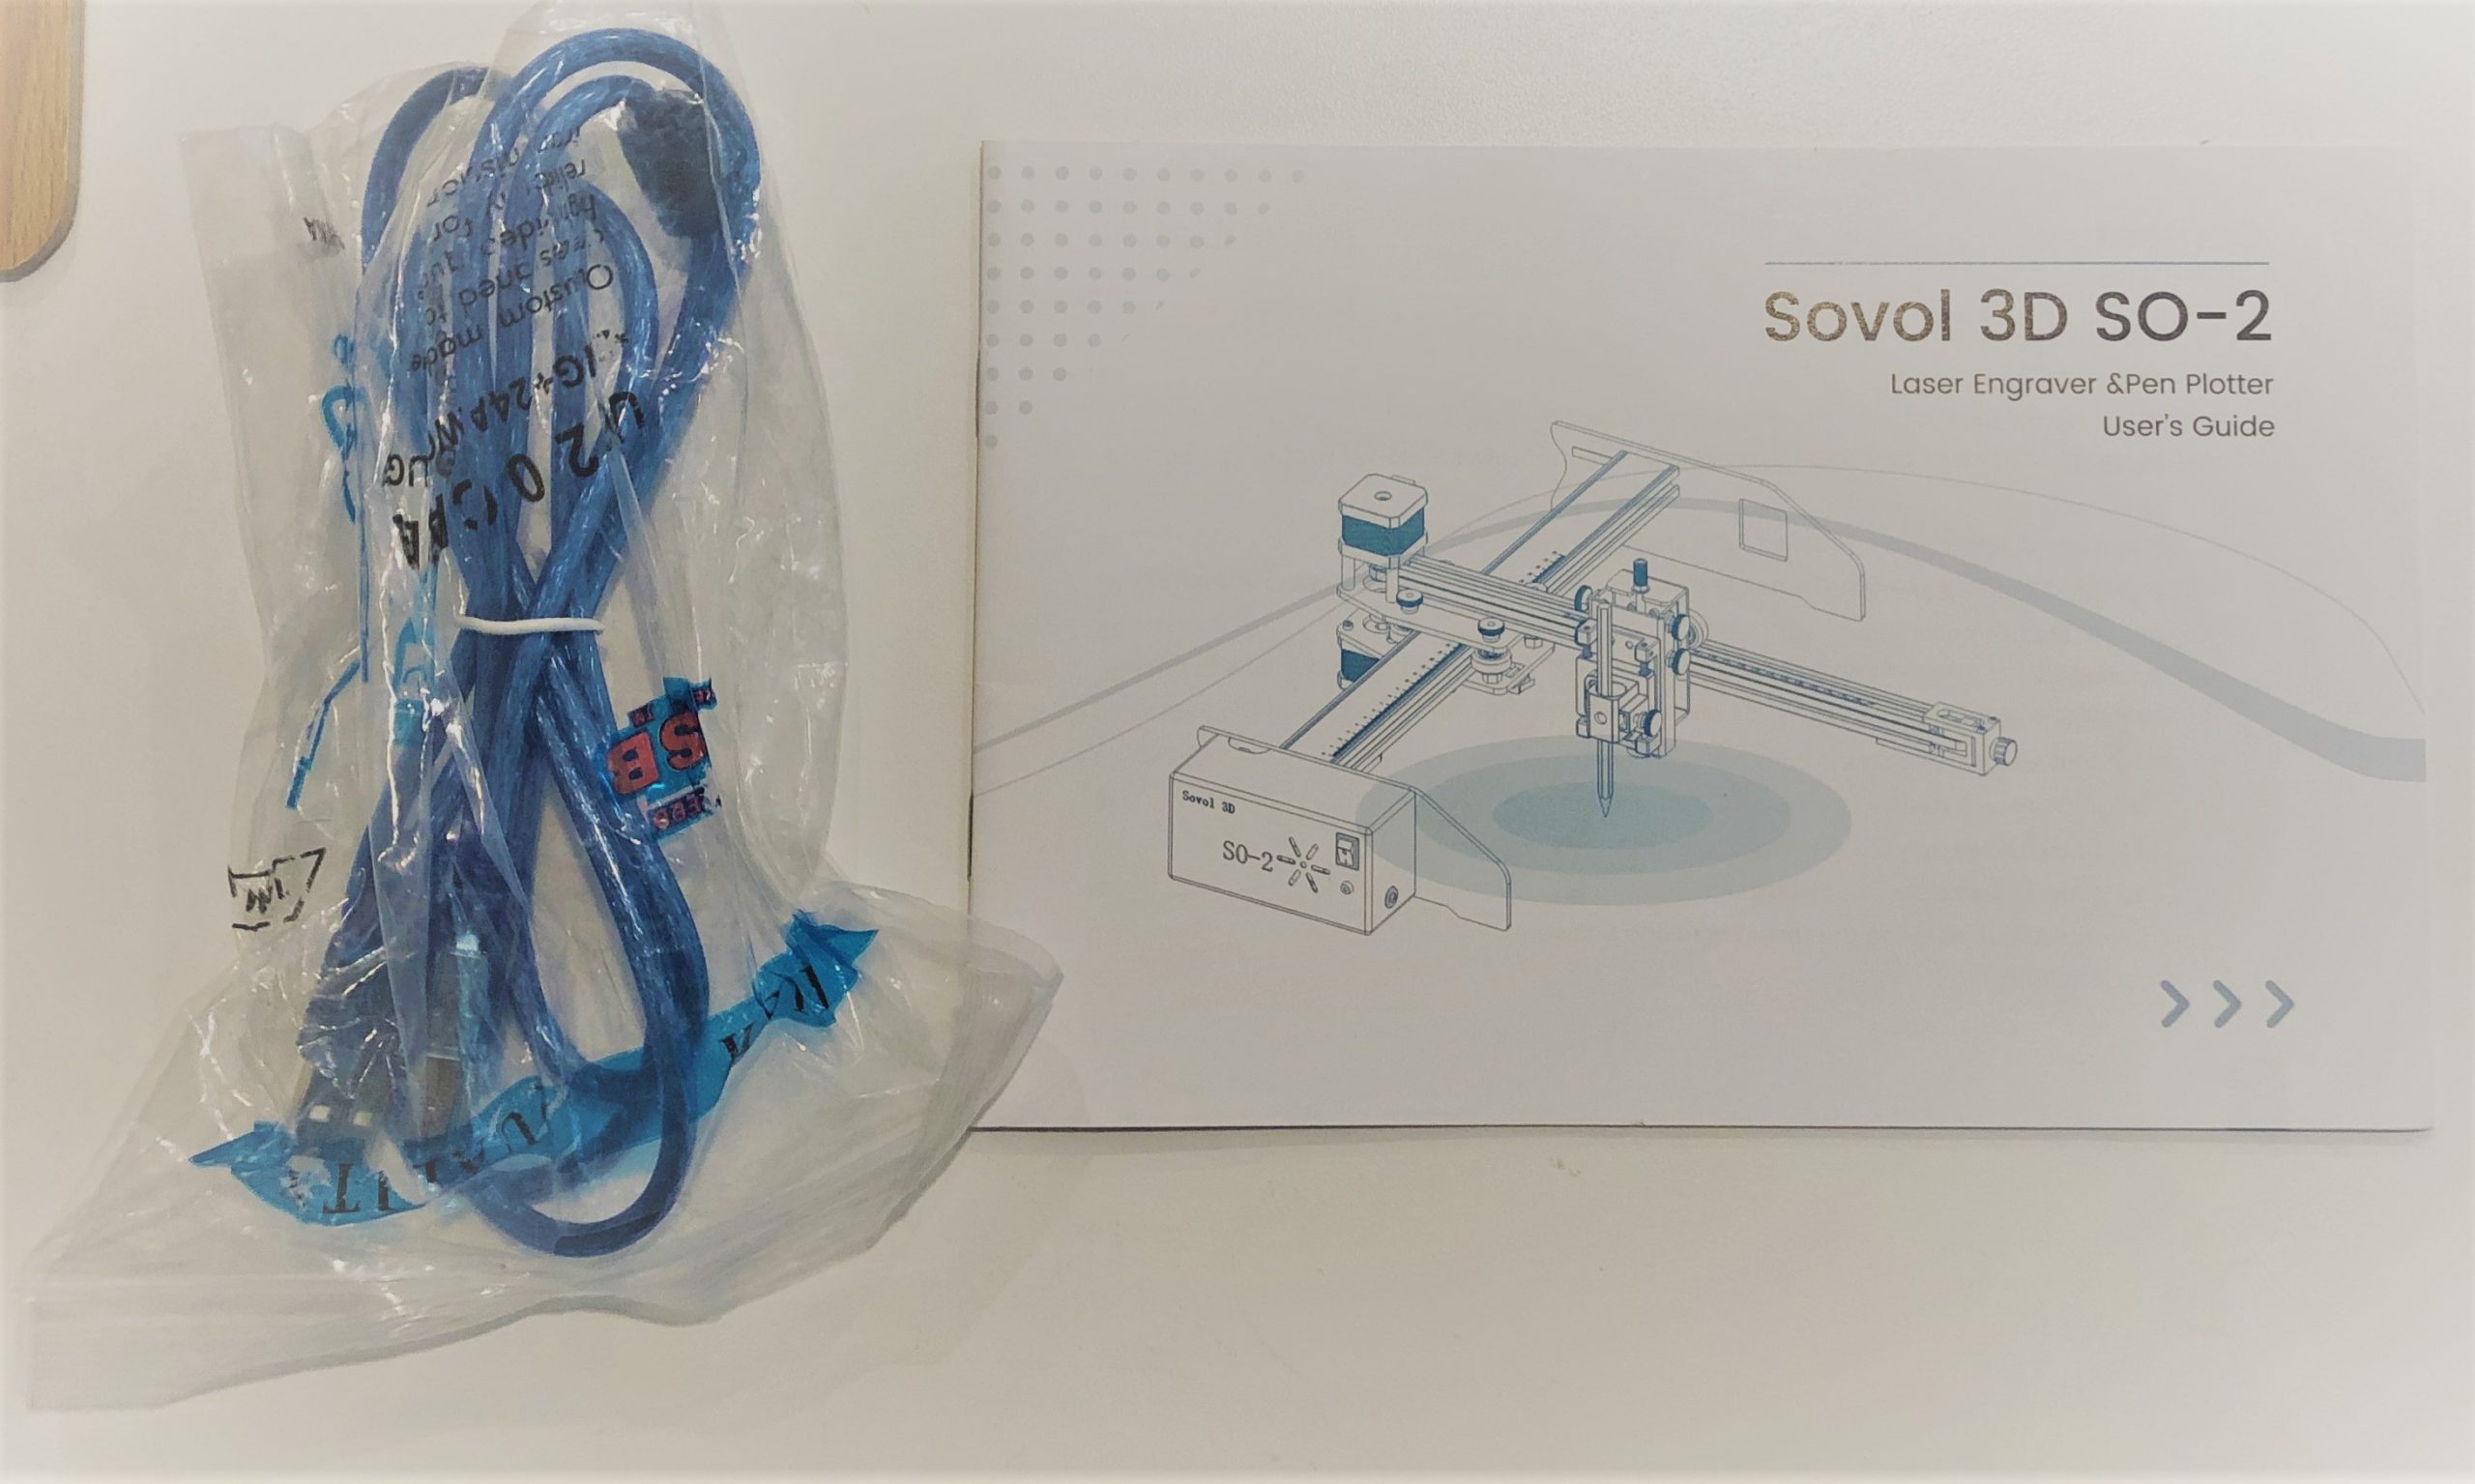
- Instruction manual
- Various Allen wrenches and wrenches
- MicroSD card with sample files, Inkscape software
- MicroSD card USB adapter
- USB cable to connect the plotter to computer
Here are some pictures from unboxing:
Assembly
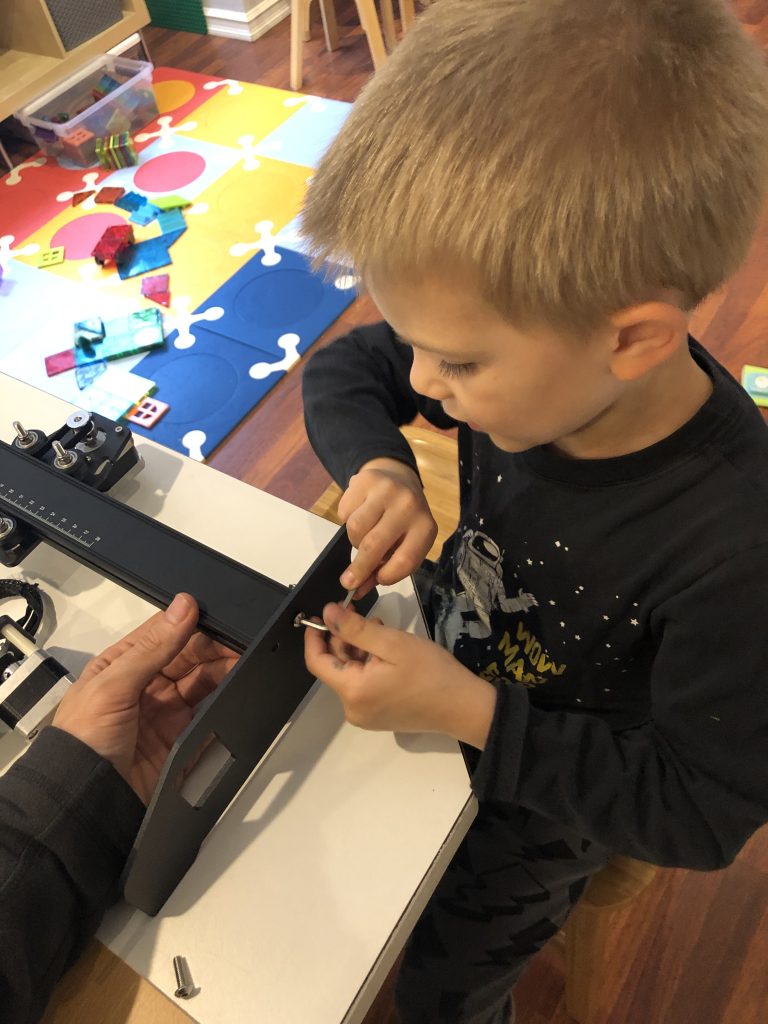
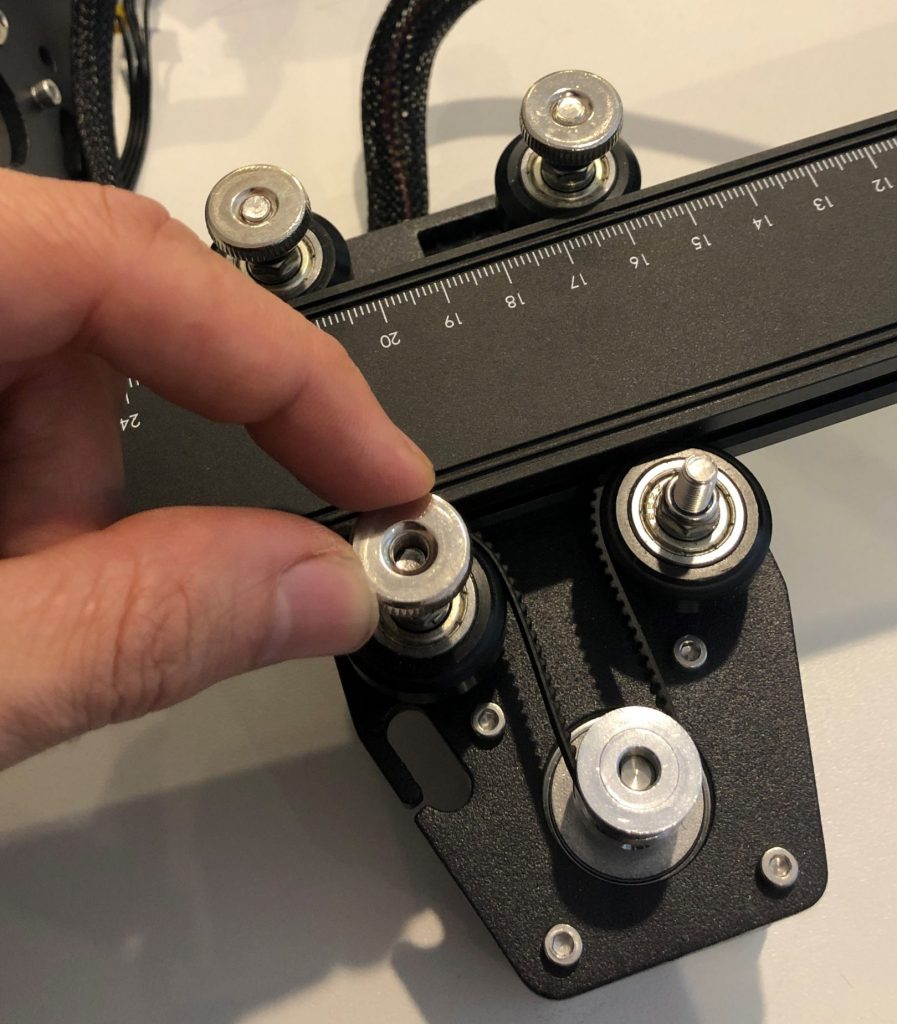
To assemble the machine after it’s taken out of the box, the two axes (X-axis and Y-axis) need to be joined together using four nuts, and a metal piece need to be joined to one of the sides with two bolts. One of my children helped me screw these parts together:
After tightening these two bolts on the side, I took off the nuts that were on top of the four bolts in the picture below, put the two axes on top of each other, and put the nuts back, tightening them by hand all the way:
Finally, to complete the assembly, the wires all need to be connected to the motors and to one of the limit switches on the X axis.
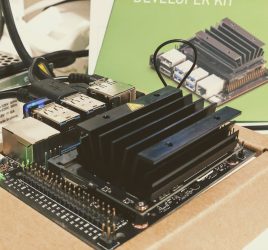
When the wires are connected and all bolts are tightened, the main assembly is done. Next, I decided to first test the plotter function so I attached the pen holding mechanism. In order to test the plotting function, I had to connect the plotter to a computer and explore the software to send commands / files to it.
Software installation on Raspberry Pi.
In order to operate the plotter, I had to install the following software on the computer that I will be using with the plotter:
- Inkscape (Vector drawing software)
- Universal GCode sender
I will be using a Raspberry Pi mini computer to work with the plotter, so I installed those two programs on it. For installing Inkscape, I used Snap installer: https://snapcraft.io/install/inkscape/raspbian, and for installing UGS (Universal GCode sender), I downloaded it from here: https://winder.github.io/ugs_website/download/. If you are using Mac OS or Windows, just download and install those programs as you would install any other software,
In order to send the files to the plotter, the vector output from Inkscape has to be converted to GCode that the plotter understands. This GCode is then sent by using Universal GCode Sender application to the plotter.
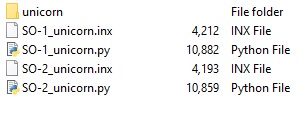
Sovol provided Inkscape extension that lets you easily save a vector file (SVG file) to GCode that the plotter will understand. This extension is included on the micro SD card that came with the plotter and should work on any platform, using Inkscape version 1 and above. I took the extension and placed it into Inkscape extensions folder. Here are the files I had to move into extensions folder:
With the extension installed, I opened Inkscape, created a simple shape and used “Save As” menu option to save as “Sovol SO-2 GCode”. Here are the settings that I used to do some sample plots:
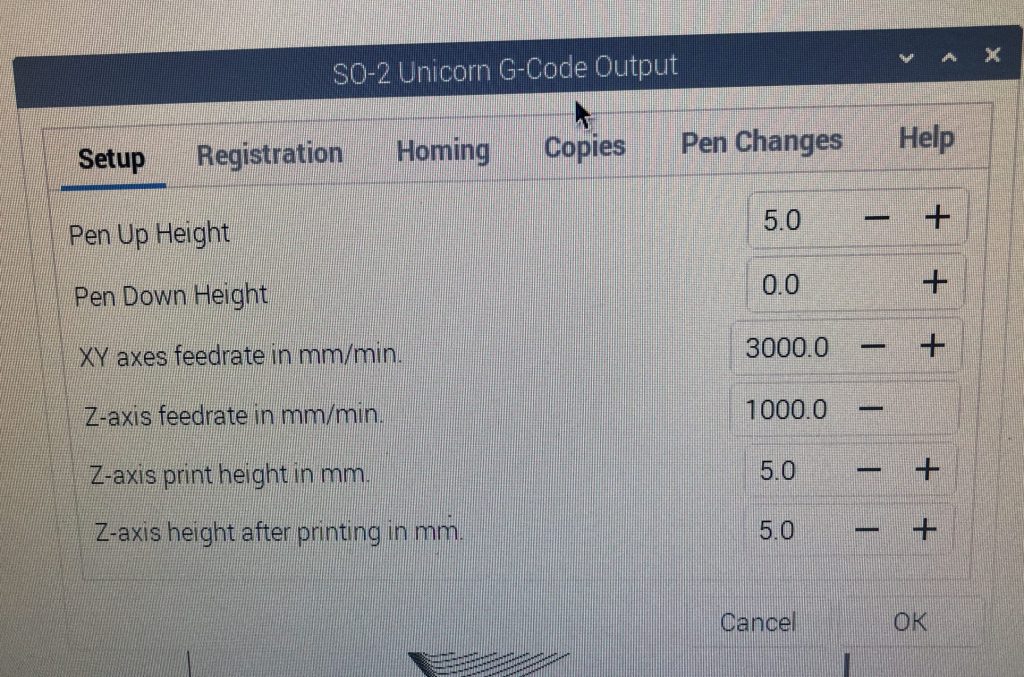
As I understand, the values are as follows:
- Pen Up Height – how high to pick up the pen above the paper (in millimeters)
- Pen Down Height – how low to put the pen down above the paper (in millimeters)
- XY axes feedrate in mm/min – speed of moving the pen in x/y directions. Values of ~500-1000 would slow down the plotter, values of 2000-3000 would make it go as fast as it can.
- Z-axis feedrate – how fast to pick up the pen or to lower it
- Z-axis print height in mm – the total height of the pen up/down travel
- Z-axis height after printing in mm – how high to pick up the pen after the print is done
Plotting impressions:
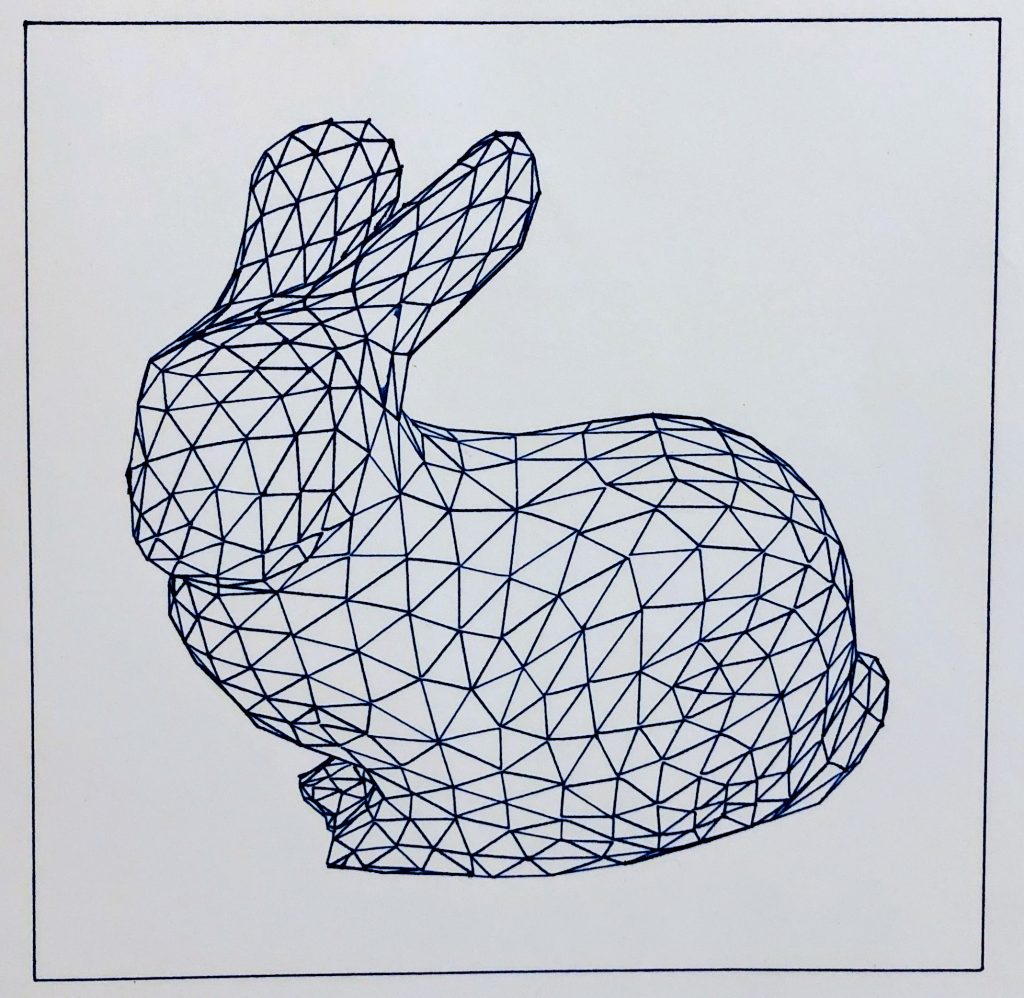
One of the websites I run, PlotterFiles.com has hundreds of vector files (SVG) ready for plotting. So I went over there and grabbed a few, for example this file of a Stanford bunny.
I also got one of the files from my Rad Polygons SVG Pack:
In order to do a simple initial test, I used Uni-ball vision pen (available on Amazon at https://amzn.to/3lPm4hV).
You can see the first plots recordings here:
And photos of completed plots are below:
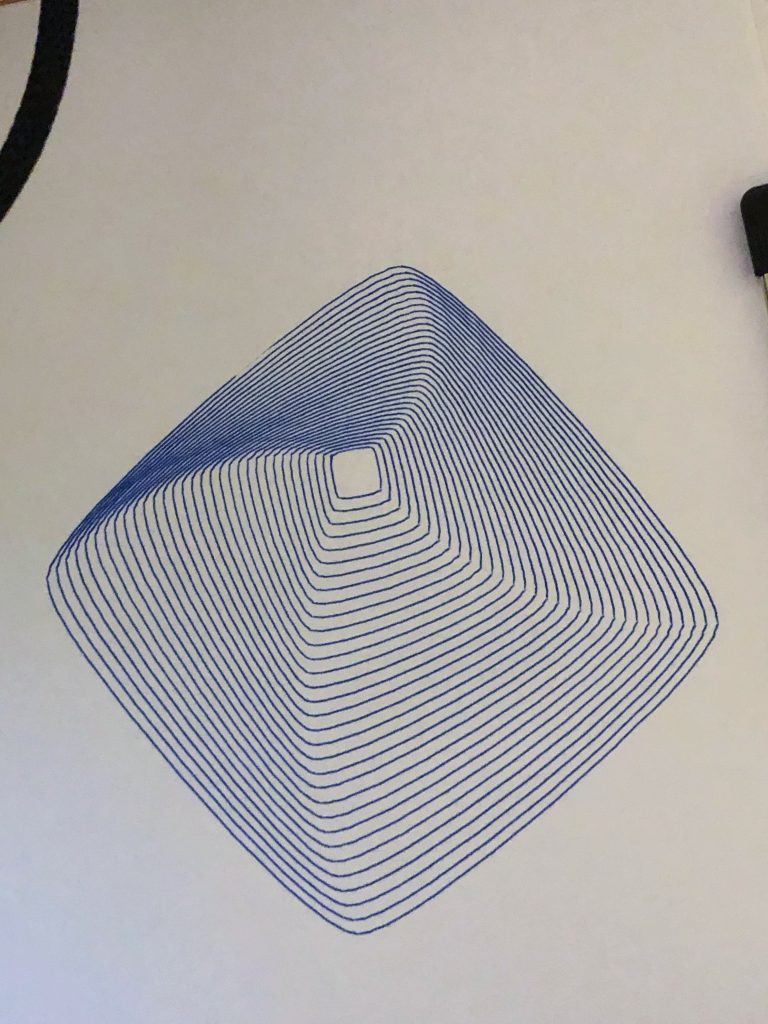
Even though the plotter did a great job, the pen didn’t spread the ink evenly
I also made a shared Google Drive where I uploaded my GCode and original SVG files. Please take a look at it here if you’re interested.
Tips and Tricks
There are a few tricks that I learned by using this plotter, in order to get best plots out of it.
Speed. Speed of X/Y travel and of Z-axis (pen up/down), matters a lot with this plotter. The default values that are embedded in Inkscape extension, are reasonable, but you can try lowering the speed of the travel and of the pen up/down movement, to get better result.
Leveling
One of the first things I noticed with this plotter, is that it might need some leveling before you start plotting, in order to get pen pressure that is even throughout your plot. This kind of plotter has a lot in common with 3D printers, where consistent initial distance of the print head above the surface is extremely important.
In order for me to level the plotter, I turned it off, put a pen in the pen holder, and set the pen to be just slightly above the paper. I then moved the pen to all four corners of the paper, and if the pen was not at the same height above the paper on any of these corners, I would put a piece of paper / cardstock under one or two corners of the metal plates that hold together the Y-axis. Then see if the pen is above all corners of the paper the same height. This process could be a bit tricky at first, but without good leveling you might not get consistent results.
SVG File optimization
In order to have the plotter draw your SVG file quickly, I suggest you optimize the SVG file using a tool such as VPype. After installing VPype as a command line tool, you would need to navigate to the same folder where your SVG file is located, and run this command (replace “mySVGFile.svg” with your own file name):
vpype read mySVGFile.svg linesimplify linemerge linesort write mySVGFile-optimized.svg
After the file is optimized, you can open it in Inkscape and convert to GCode as described above.
Pros and Cons
From my experience with plotters so far, I liked the following attributes of this plotter:
- Affordable (price point is competitive)
- Multi-function (laser attachment comes with the machine)
- The plotter has homing function to put the pen in the same initial position
- GCode allows for good amount of control (you can change many settings and experiment with the output results)
And the things that ended up taking more time that I would like, were:
- “Bed” (pen mechanism) leveling. I wish that leveling was not necessary
- SVG to GCode conversion. This process can be tricky and take time to figure out. There might be other SVG to GCode options out there besides Inkscape that could make the process easier.
Overall, I’m happy with the results of this plotter so far and will keep using the plotter to draw some of the generative art that I’ve been making with Blender. I will also try out the laser function soon and talk about that in the next post.
If you are interested in exploring this plotter, take a look on the manufacturer’s website here: https://sovol3d.com/!